# Pipeline Breadcrumbs
Make long-running pipelines explain their work through numbered steps, ordered artifacts and a run manifest. Preserve evidence to investigate exceptions and incorrect results.
Published: 2026-10-05
Updated: 2026-10-05
Source: https://matlus.com/writing/pipeline-breadcrumbs/
Repository: [Pipeline Breadcrumbs](https://github.com/matlus/pipeline-breadcrumbs)
Tags: progress-reporting, structured-logging, debugging, error-handling, dependency-injection, python
---
A pipeline has been running for twenty minutes. It has loaded some documents, called a model several times and started assembling a result. Then it fails.
You have an exception. You know where the program finally gave up. But what had it accomplished before that? What did the model actually return? Was the input to the failing step already wrong?
Or perhaps it finished without an error, but the final report is wrong. Now you need to find the first step that produced an incorrect result. A green completion flag cannot tell you that.
Those are different questions, and a traceback cannot answer all of them.
I want a pipeline to leave an account of its work that somebody else can follow. That person might be a developer, an operations team member with no access to the running application, or a coding assistant investigating a defect. They should be able to open the run's folder, understand its sequence and find the evidence relevant to the failure.
That is the purpose of **Pipeline Breadcrumbs**: numbered progress logs and self-describing artifacts that tell the same story about one execution.
## Start with the trail somebody needs to read
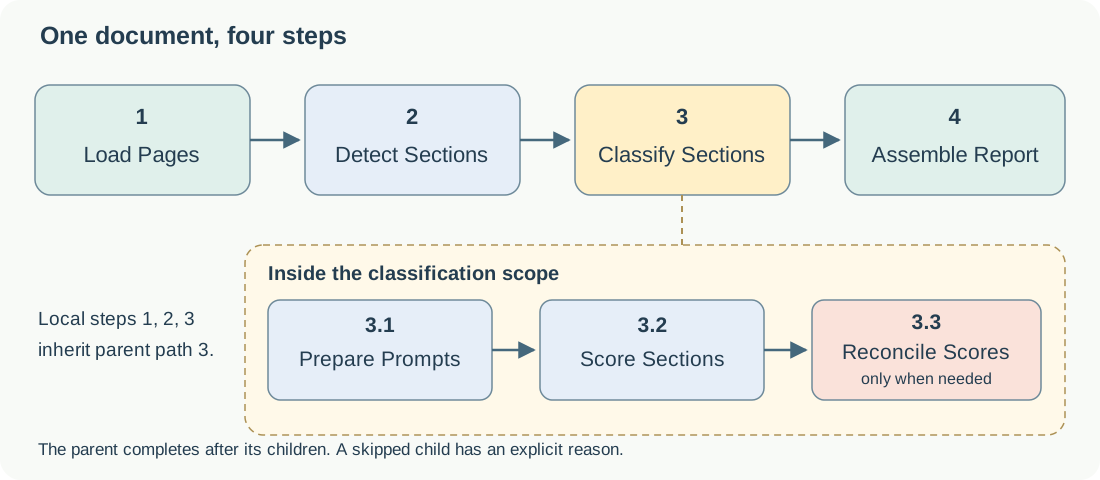
Consider a document-analysis pipeline. For each document it loads page text, detects sections, classifies them and assembles a report. Classification has three steps of its own: prepare prompts, score the sections, and reconsider any scores below a confidence threshold.
Each processor owns its step. Passing the classification scope to its processors places their local steps under step 3.
One run processes `Contract 12.pdf` and `Lease 4.pdf`. Its folder has this shape:
```text
artifacts/20261005_105428_batch/
manifest.json
run.log
Contract 12/
Lease 4/
```
The timestamp identifies this execution. Running the documents again creates another folder. If two runs receive the same timestamp and label, the folder helper adds a numeric suffix. The earlier run remains available for comparison.
Inside `Contract 12`, a selection of the filenames looks like this when sorted by name:
```text
Contract 12_step_01_page_text_page_0000.txt
Contract 12_step_01_page_text_page_0001.txt
Contract 12_step_02_detected_sections.json
Contract 12_step_02_raw_detection_response_page_0000.txt
Contract 12_step_02_raw_detection_response_page_0001.txt
Contract 12_step_03.01_classification_prompts.json
Contract 12_step_03.02_raw_score_response_page_0000.txt
Contract 12_step_03.02_section_scores.json
Contract 12_step_03.03_reconciled_scores.json
Contract 12_step_04_analysis_report.md
```
You can already see how the report was produced. The names identify the document, the step, what the file contains and, where necessary, the individual page. There are more page files in the complete run; this listing is shortened to show the progression.
Why put the step number so early in the filename? Because the file explorer sorts by that name. If every developer invents a different naming convention, the folder becomes a collection of files you must understand before you can navigate it. A consistent name gives the reader a useful order immediately.
The shape is:
```text
_step__[_].
```
Each step segment is zero-padded, so `02.09` comes before `02.10`. The current implementation accepts local step numbers from 1 through 99. A page discriminator such as `page_0001` distinguishes multiple artifacts of the same kind produced by one step.
I keep a work item's files together in one folder. Grouping them into `pages`, `model_responses` and `reports` subfolders may look tidy, but it makes the reader reconstruct the execution across several locations. File explorers also tend to put folders before files. The first thing the reader encounters can cease to be the first step.
This ordering has a precise scope. Within a step, artifact kinds sort by name, so `detected_sections.json` appears before the raw replies even though the replies were saved first. Work item folders sort by document name. The filenames reveal the pipeline's step structure; the log supplies the actual sequence of events, including concurrent completions.
## Logs describe progress; artifacts preserve the work
A progress message might say that four sections were detected. The corresponding artifact contains those sections. Both are useful, for different questions.
The log tells you what is happening, how much work has finished and how long it took. Artifacts retain page text, prepared prompts, raw replies, intermediate results and deliverables. Putting a large model response into a log message makes the log harder to scan and the response harder to retrieve as a useful document.
Here is a shortened step boundary from the demonstration:
```text
STEP 2: Detect Sections - STARTED (10:54:29)
Detecting sections (pages=4, concurrency=3)
Calling the model (page=0)
Calling the model (page=1)
Calling the model (page=2)
...
STEP 2: Detect Sections - COMPLETE (10:54:29)
Detected 4 section(s) in 0.632s (sections=4)
```
The omitted lines contain page completions and artifact emissions. These times belong to a sample run of an offline demonstration with deliberate delays; they are not model-performance measurements.
The start and finish give the step a boundary. The lines between them report progress with counts and identifiers. The finish supplies an outcome that means something to the reader. “Detected 4 sections” explains more than “Done.”
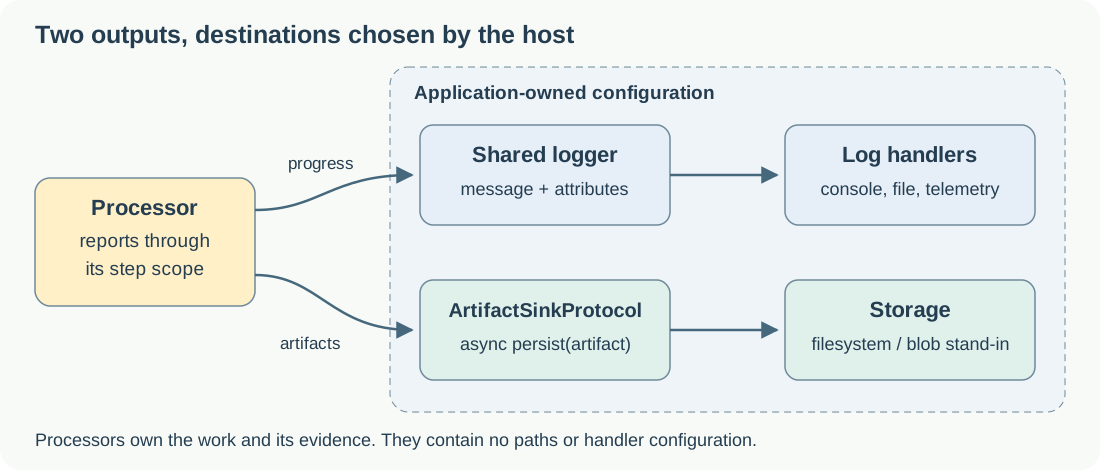
An artifact is emitted through a scope and passed to an application-supplied object implementing `ArtifactSinkProtocol`. Its asynchronous `persist` method receives the artifact's identity and bytes. The application chooses a filesystem sink for the local demonstration and a blob-storage stand-in for the hosted demonstration. Every artifact goes to the chosen sink.
Artifacts have an `INTERIM` or `OUTPUT` role. A raw reply is usually interim; a report is an output. That role describes the file's purpose. It does not cause the library to discard interim evidence in production. A host can use the role to decide retention or storage tier while keeping the diagnostic record it needs.
## Give a step one identity
The declarations read like a table of contents:
```python
from typing import Final
from pipeline_breadcrumbs import Step
LOAD_PAGES: Final[Step] = Step(1, "Load Pages")
DETECT_SECTIONS: Final[Step] = Step(2, "Detect Sections")
CLASSIFY_SECTIONS: Final[Step] = Step(3, "Classify Sections")
ASSEMBLE_REPORT: Final[Step] = Step(4, "Assemble Report")
```
`Step` is an immutable value. It holds a number relative to its parent, a display name and a machine key. `Detect Sections` produces the key `detect_sections` by default.
That separation matters when a pipeline changes. Insert a step before detection and its number may become 3. An alert concerned with detection should still find `detect_sections`. Use the key for that identity, and the number to describe position. If you also want to change the display name without changing the key, provide it explicitly:
```python
DETECT_SECTIONS: Final[Step] = Step(
3, "Identify Document Sections", requested_key="detect_sections"
)
```
The key is stable only if you preserve it. Deriving it again from a renamed display label would produce a different key.
The absolute step path is a tuple of integers. A child numbered 10 under step 2 has the path `(2, 10)`. Its display is `2.10`, and its filename segment is `02.10`. A floating-point number cannot represent that identity: `float("2.10")` is `2.1`. Keeping the parts as integers removes the ambiguity.
## A small working example
Before looking at nested classification, let's make one step leave a trail. Use the repository revision and setup commands under “Try a successful run, then a failure” below, then save this as `article_example.py` in that checkout. The repository requires Python 3.14 or later.
```python
import asyncio
import logging
from pathlib import Path
from typing import Final
from pipeline_breadcrumbs import (
ArtifactKind, ArtifactSinkProtocol, BreadcrumbFormatter, PipelineRun, Step,
StepHostProtocol, StepScope, WorkItem, WorkItemScope,
)
from pipeline_breadcrumbs.hosting import (
FileSystemArtifactSink, attached_run_log, create_run_folder,
)
LOAD_PAGES: Final[Step] = Step(1, "Load Pages")
PAGE_TEXT: Final[ArtifactKind] = ArtifactKind(
"page_text", "txt", "text/plain"
)
async def load_pages(step_host: StepHostProtocol, pages: list[str]) -> None:
step_scope: StepScope
async with step_host.step(LOAD_PAGES) as step_scope:
page_number: int
page_text: str
for page_number, page_text in enumerate(pages):
await step_scope.emit(
PAGE_TEXT,
page_text.encode("utf-8"),
discriminator=f"page_{page_number:04d}",
)
step_scope.info("Loaded a page", page=page_number)
step_scope.outcome(f"Loaded {len(pages)} page(s)", pages=len(pages))
async def main() -> None:
run_directory: Path = create_run_folder(Path("artifacts"), "article")
logger: logging.Logger = logging.getLogger("article_pipeline")
logger.setLevel(logging.INFO)
logger.propagate = False
artifact_sink: ArtifactSinkProtocol = FileSystemArtifactSink(run_directory)
pipeline_run: PipelineRun
work_item_scope: WorkItemScope
with attached_run_log(logger, run_directory, BreadcrumbFormatter()):
async with PipelineRun(
pipeline_name="page-loading", artifact_sink=artifact_sink, logger=logger
) as pipeline_run:
work_item: WorkItem = WorkItem(id="contract-12", name="Contract 12.pdf")
async with pipeline_run.open_work_item(work_item) as work_item_scope:
await load_pages(work_item_scope, ["Definitions", "Payment Terms"])
asyncio.run(main())
```
Run it with `uv run article_example.py`. Open the newest `artifacts/*_article` folder. It contains `run.log`, `manifest.json` and a `Contract 12` folder with two numbered page-text files.
Notice where the decisions belong. `main` chooses the directory, sink and logger. `load_pages` knows which work it performs and which artifacts it produces. It receives a scope that carries the run's context, so it needs no filesystem path and does not configure a logging handler.
The context manager logs `STARTED` on entry and `COMPLETE` on a clean exit. If an exception escapes, it records `FAILED` and lets the exception continue. The processor supplies the meaningful outcome; it does not repeat the mechanics of starting a timer and closing the step.
`ArtifactKind` describes the content with a key, extension and media type. The artifact derives its own filename. Keys such as `result`, `data` and `payload` are rejected because they do little to help somebody find the right file later.
## Why use a sink class instead of a callback?
The processor needs somewhere to send an artifact. There are two reasonable ways to express that dependency.
An asynchronous callback has the type `Callable[[Artifact], Awaitable[None]]`. The application supplies a function, and the library awaits it for each artifact. That is a small contract, and a local asynchronous function can serve a simple test perfectly well.
The other option is an object with a named operation. This is the contract used here:
```python
from typing import Protocol
from pipeline_breadcrumbs import Artifact
class ArtifactSinkProtocol(Protocol):
async def persist(self, artifact: Artifact) -> None: ...
```
The deciding question was: what must the sink keep between calls?
The filesystem sink keeps its run directory and a registry of which work item claimed each folder. If two different work items map to the same folder, it raises instead of mixing their evidence. A storage-container implementation needs its container client and run prefix. The in-memory test recorder keeps the artifacts it received.
A callback can capture those things in a closure, or the application can pass a bound method from an object. Both are workable. In this design, the implementations already have an identity, state and a lifetime. Passing the sink object makes that responsibility explicit at the point where the application constructs the run.
| Design question | Async callback | Object implementing the protocol |
|---|---|---|
| Where does state live? | In a closure or an object behind the callback | In the sink instance supplied to the run |
| What names the operation? | The callable's signature describes its input and result | `ArtifactSinkProtocol.persist` names the responsibility |
| How does a test receive artifacts? | An async function can append to a captured list | `ArtifactRecorder` collects them and provides inspection helpers |
I chose the class. `FileSystemArtifactSink`, the demo's `BlobStorageArtifactSink` and `ArtifactRecorder` implement the same protocol. The application selects an implementation just as it selects its other services. The processors continue to call `step_scope.emit(...)`; none of them needs to know which class was selected.
The protocol fits the other contracts already in use, including `StepHostProtocol` and the model gateway protocol. It also gives callers one supported form. `PipelineRun` accepts an `artifact_sink` object with `persist`; it does not offer a second callback API that callers and maintainers must account for.
The sink raises the error appropriate to its destination. `RunContext.persist` calls the sink and wraps an ordinary exception in `ArtifactSinkError`, retaining the artifact identity and original cause. Each storage implementation can concentrate on persistence while the run supplies the common diagnostic behavior.
## Nest an engine without teaching it its new position
The scope hierarchy is small:
```text
PipelineRun
WorkItemScope
StepScope
child StepScope
```
Both work item scopes and step scopes implement `StepHostProtocol`. It exposes two operations: open a step, or record that a step was skipped and why.
The classifier opens step 3. It then hands that scope to the prompt builder, scorer and reconciler. Those processors declare local steps 1, 2 and 3, so their paths become `3.1`, `3.2` and `3.3`.
There is no renumbering code in the processors. Place the classifier under a different parent and the scope composes the new paths. The same component can operate directly under a work item or inside a larger pipeline.
The scope travels as a method argument. A reusable processor should not retain one run's scope on a long-lived instance, where another invocation could accidentally use it. The scope belongs to the work currently being performed.
A conditional step also needs an explanation. If every section already has sufficient confidence, the classifier calls:
```python
step_scope.skipped(
RECONCILE_SCORES, "no sections below the confidence threshold"
)
```
That creates a `SKIPPED` record for step `3.3`. The absence of a reconciliation artifact is consistent with the decision, and the log and manifest explain it explicitly. An absent file by itself would leave the reader guessing whether the step was skipped, failed or never reached.
## Save the evidence before the operation that can reject it
Suppose the model returns malformed JSON for page 2. Where do you save that reply?
If you save only successfully parsed results, the most useful evidence disappears precisely when you need it. The model processor therefore follows this order, shown here as an excerpt from its page-processing method:
```python
raw_reply: str = await self._model_gateway_protocol.detect_section(page_number, page_text)
await step_scope.emit(
RAW_DETECTION_RESPONSE,
raw_reply.encode("utf-8"),
discriminator=page_discriminator(page_number),
)
detected_section: DetectedSection = self._parse(page_number, raw_reply)
```
`RAW_DETECTION_RESPONSE` is a text artifact kind. The page discriminator identifies which reply you are examining. Only after the sink has accepted the raw bytes does parsing begin.
Now a parse error leaves something you can inspect. You can distinguish a malformed model reply from a valid reply the parser mishandled. You can compare it with the page text and with replies from other pages.
The demonstration processes up to three pages concurrently. One page can finish before an earlier page, and the progress log reflects that. For this workload, the detector uses `asyncio.gather(..., return_exceptions=True)` to collect every page outcome, then raises the first failure in page order. A malformed reply on one page does not immediately cancel the others, so their available replies can also be captured.
That is a deliberate policy in the document-analysis processor. The breadcrumb library does not impose a concurrency policy on every pipeline. Waiting for every result makes sense here because those results help explain the failure. Another workload may need to stop outstanding work promptly.
If persistence itself fails, there may be no saved reply. The library translates a sink exception into `ArtifactSinkError` carrying the artifact's identity. That distinction matters: a storage failure and a response-parsing failure require different investigation.
## Let the failure carry its step, then log the exception once
A failed inner step produces a boundary record with its elapsed time and the exception's type and message. Enclosing scopes can record their own failed boundaries as the exception propagates. Those records are warning-level breadcrumbs without repeated tracebacks.
The application logs the exception with its traceback at the outer boundary where it decides what happens next.
When an exception supports `contextual_data_by_name` and `add_contextual_data`, the innermost failing step adds three facts:
```text
FailedAtStepNumber: 3.2
FailedAtStepName: Score Sections
FailedAtStepKey: score_sections
```
An outer step does not replace them with its own identity. The exception carries the location of the inner failure to the place where it is finally logged. Exceptions participate through that small structural contract; applications do not have to inherit from a library-owned exception base class.
In the demo, the application catches a document-analysis failure around one work item, logs it and moves on to the next document. If `Contract 12.pdf` fails, `Lease 4.pdf` can still complete. The overall run is marked failed because one work item failed, even though the application handled the exception and finished the batch.
Continuing the batch is the application's decision. The step scope reports what happened and preserves the exception.
## Read the manifest first
When the run exits through its context manager, it emits `manifest.json` through the same artifact sink. This is a run-level artifact, so it does not need a pretend document identity to fit the model.
The manifest records each work item, each step opening, statuses, elapsed times, outcomes, failures and emitted artifacts with their byte counts. It gives you an index into the saved artifacts. The field names identify their subjects explicitly: `work_item_name` for a work item, and `step_path`, `step_key` and `step_name` for a step. A shortened failed record looks like this:
```json
{
"work_item_name": "Contract 12.pdf",
"work_item_status": "FAILED",
"step_records": [
{
"step_path": "2",
"step_key": "detect_sections",
"step_name": "Detect Sections",
"step_status": "FAILED"
}
]
}
```
The full record also contains timing, outcomes, failure details and artifact records. You can identify the step without having to infer whether an unqualified `name` belongs to the document or the operation.
Start with the failed work item and step. Open that step's available summary and raw response files. Then inspect the preceding step's output. A scoring failure may originate in detection, and an incorrect report may be the faithful assembly of already incorrect scores. Follow the values back until you find the first point where they departed from what you expected. Use the local `run.log`, or the hosted process log, to fill in the progress between the saved results.
This is also useful when nothing throws. A step can complete successfully and produce the wrong answer. Its outcome and artifacts give you something more useful than a green completion flag.
The manifest is built from immutable events rather than a dictionary that replaces a record whenever the same step path appears again. Reopening a step or work item retains its execution history. However, retaining manifest records does not automatically version file contents: the filesystem sink writes to the artifact's derived filename. Re-emitting the same identity writes to the same path. Use distinct discriminators or separate runs when multiple attempts' files must coexist.
The manifest is written at run exit, not continuously checkpointed. An abrupt process termination or a storage outage can leave earlier artifacts without a completed manifest. While a run is still active, its log and already persisted artifacts are the evidence available.
## Keep storage and logging decisions in the application
The application supplies the logger and an ArtifactSinkProtocol implementation. Processors report through the scope without selecting destinations.
The library sends ordinary Python log records with named attributes through `logging`'s `extra` argument. For example:
| Attribute | What it identifies |
|---|---|
| `pipeline.name` | The pipeline being run |
| `pipeline.run.id` | This execution |
| `pipeline.work_item.name` | The document or other item |
| `pipeline.step.number` | The composed step path |
| `pipeline.step.key` | The step's machine identity |
| `pipeline.status` | A boundary's status |
| `pipeline.elapsed_seconds` | Duration at completion or failure |
| `pipeline.detail.pages` | A caller-supplied progress count |
The `pipeline.` prefix is this library's vocabulary. It is not an OpenTelemetry semantic convention. Keeping it fixed lets queries reuse the same attribute names across pipelines, with `pipeline.name` distinguishing the applications.
Each event is one log record. `BreadcrumbFormatter` turns a boundary record into the readable banner; a structured handler receives the message and attributes without having to parse separator lines. Caller fields are placed under `pipeline.detail.` so names such as `filename` do not collide with standard log-record attributes.
Time display also belongs to the formatter. `TimeDisplay.BOUNDARIES` shows a time in each boundary header, `NONE` omits displayed times, and `ALL` adds them to every line. The underlying record still has its timestamp. Elapsed duration is measured with a monotonic clock, while run-folder names and displayed times use local time.
One application-owned logger is shared through the scopes. Each handler can select its level and destination. In the local demo, informational messages go to the console and `run.log`. In the hosted profile, they remain in the process log while an exception handler writes error records to `telemetry.jsonl`.
That JSON-lines handler is an offline stand-in. The demo does not connect to Application Insights. A real host can attach its telemetry integration to the same logger; the core library has no OpenTelemetry dependency and does not create spans.
Storage is a separate choice. The local profile constructs `FileSystemArtifactSink(run_directory)`. The hosted profile constructs `BlobStorageArtifactSink(container_directory, run_name)`, which lives in the demo application. Both implement `ArtifactSinkProtocol`, and both receive every artifact, including the manifest.
The hosted demonstration represents a container with a local directory called `artifact-container`. It names each simulated blob `//`, with the manifest directly under the run name. The step-bearing filenames stay the same. For an output root called `artifacts`, a failed hosted run has this arrangement:
```text
artifacts/
/
telemetry.jsonl
artifact-container/
/
manifest.json
Contract 12/
Contract 12_step_01_page_text_page_0000.txt
Contract 12_step_02_raw_detection_response_page_0002.txt
Lease 4/
...
```
This listing is shortened. The hosted profile creates no `run.log`; informational breadcrumbs go to the process log, while exception telemetry belongs in the run's own directory. The artifacts belong under the container directory. On a clean hosted run there is no exception telemetry file.
The blob sink is still a local stand-in, so no cloud upload occurs. A production implementation would own the storage SDK's container client and implement the same `persist` method. Moving the bytes to a real service is work still to be done; choosing between the two sink classes already works in the demo.
The important separation is already present: moving the application to a different environment does not require each processor to learn a new logging service or storage API.
## Give people and coding assistants the same evidence
In the production applications this practice came from, operations teams could inspect the artifact folder even when they could not inspect the running system. They could report that step 2 looked correct but a file from step 3.2 contained something unexpected. The naming convention gave them a way to describe the problem precisely.
The same trail proved useful when working with coding assistants. An assistant could run the pipeline, read the log and files, identify an incorrect intermediate result, change the implementation and run it again. The files from the two runs remained available for comparison.
There is no special assistant API in that arrangement. The useful capability comes from exposing understandable evidence through ordinary files. A step name supplies intent; its artifacts supply the material needed to check whether the result matches that intent.
You can test that contract at the application's public boundary too. The library provides an `ArtifactRecorder` sink and a `RecordCapture` logging handler. Pass the recorder instance as `artifact_sink`; its `persist` method retains the artifacts in memory. An acceptance test can then inspect which artifacts were emitted, what they contain, and which statuses and attributes were logged. The offline demo replaces the model gateway while exercising the processors and scopes.
Those assertions concern what a consumer can observe. Reorganizing the classes should not require rewriting an expectation that a malformed reply is preserved before its parse error escapes.
## What saved artifacts make possible next
Preserving intermediate results creates a useful starting point for resuming expensive work. If detection completed and scoring failed, why pay for detection again?
The current library does not implement restart-from-step. That would require an artifact reader and an orchestration decision about which saved values replace earlier computations. It also needs an explicit agreement about whether a saved result is complete and compatible with the inputs and code being run now.
Summary artifacts such as `detected_sections.json` are plausible inputs to that design. Raw model replies serve a different purpose: they preserve evidence, and still need interpretation before they become the typed values the next processor expects.
For normal execution, keep passing results from one processor to the next in memory. Persisting an artifact should not turn every ordinary method call into a write followed by a read. The saved trail supplies diagnostics today and an opportunity for a separately designed restart mechanism later.
## Try a successful run, then a failure
The repository includes the complete document-analysis example. It uses a fake model gateway and deliberate pauses, so these commands require no model credentials or outbound model calls. The checkout is pinned so the code and examples agree:
```bash
git clone https://github.com/matlus/pipeline-breadcrumbs.git
cd pipeline-breadcrumbs
git checkout 13c6b48bfb089c0de7f7c894488205a61d967eb6
uv sync --all-packages --all-groups
uv run pipeline_breadcrumbs_app
uv run pipeline_breadcrumbs_app --fail-page 2
uv run pipeline_breadcrumbs_app --host hosted
uv run pipeline_breadcrumbs_app --host hosted --fail-page 2
```
The clean run completes both documents. The failing run saves the malformed reply for page 2, records the detection failure, completes the second document and exits with code 1. In the hosted failure run, `telemetry.jsonl` contains the outer exception record in the run directory. The step breadcrumbs remain in the process log; the artifacts and manifest are under `artifact-container//`.
Open the failed run's manifest first. Find the failed step, open its raw reply, and compare it with the preceding page-text artifact. Then do the same with a successful run.
That is the test I care about for this capability: can somebody follow what the pipeline did, locate the evidence and explain the problem without first learning its implementation? If they can, the pipeline has left a useful trail.