
You have two ways of doing something. One looks faster. You might even have a good explanation for why it should be faster. How do you know that it is?
I had a URL-slug implementation that I improved, or thought I had improved, years before I put the versions into a benchmark. The result did not agree with my assumption. A later version did improve it, and this time I had a measurement to support the claim.
That is why I like having a benchmark alongside a performance experiment. First make the operation correct. Keep tests that establish its behavior. Then use the working implementation as the baseline for the changes you want to try.
Decide what you are measuring
A profiler helps you find where an application spends its time, what it calls and how often it calls it. A benchmark lets you compare particular implementations under specified conditions. These are related activities, but they answer different questions.
If the application spends most of its request time waiting for a database, a faster string comparison may make almost no visible difference. Once you have identified a relevant operation, though, a small benchmark can let you test alternatives without all the surrounding application behavior obscuring the comparison.
For the examples here I use BenchmarkDotNet. The sample repository contains comparisons of string equality, arrays and dictionaries, string concatenation and URL-slug production. Those examples are useful because the apparent winner often depends on exactly what work you ask it to do.
A small benchmark has a few moving parts
Create a console application, add the BenchmarkDotNet package, and put the operations in a public benchmark class. Here is a compact teaching example of the structure:
using BenchmarkDotNet.Attributes;
using BenchmarkDotNet.Running;

BenchmarkRunner.Run<StringComparisonBenchmarks>();

[MemoryDiagnoser]
public class StringComparisonBenchmarks
{
    private string left = string.Empty;
    private string right = string.Empty;

    [Params(10, 100)]
    public int Length { get; set; }

    [GlobalSetup]
    public void Setup()
    {
        left = new string('a', Length);
        right = new string('a', Length);
    }

    [Benchmark(Baseline = true)]
    public bool OperatorEquals() => left == right;

    [Benchmark]
    public bool InstanceEquals() => left.Equals(right);
}
The methods return their results so the harness can consume them. The class and methods are public instance members where required by the harness. Length has a public setter so the parameter values can be supplied. For each parameter value, the setup prepares the input before the measured invocations.
GlobalSetup does not run before every call to the benchmark method. It runs for each benchmark case, after its parameters have been assigned. That distinction becomes important as soon as a benchmark mutates its input. BenchmarkDotNet documents the different setup and cleanup scopes.
Build and run in Release mode, with no debugger attached:
dotnet run -c ReleaseDebugging is useful for checking your implementation. Timing optimized execution is a different activity. The project’s good-practices guide also explains why unused results and environmental differences can undermine a comparison.
Read the input before reading the winner
The example above uses equal strings constructed separately. A comparison can instead involve the same reference, different lengths, or equal-length strings that differ near the beginning or end. Those inputs give the equality operation different amounts of work.
The original repository’s StringEqualityBenchmark constructs stringB by appending a character to stringA. The two strings therefore have different lengths. That is useful evidence about that case; it does not measure scanning two long, equal strings from beginning to end.
In an early experiment, comparing == and Equals seemed to show a sizeable relative difference at sub-nanosecond scale. A broader comparison brought them much closer. It would be a mistake to turn the first result into a rule that a method call necessarily makes string equality twice as slow. Look at the operands, generated code, variation and runtime before making that claim.
The same care applies to the comparison rules. Ordinal equality, culture-sensitive equality and case-insensitive equality can return different answers. An implementation that changes the answer has changed the problem, however attractive its timing may be.
What the harness does for us
The console output contains much more than a single stopwatch reading. A normal run prepares and launches generated benchmark code, estimates an appropriate amount of work, warms it up, and collects measurements. The harness also accounts for its measurement overhead according to the selected job and strategy.
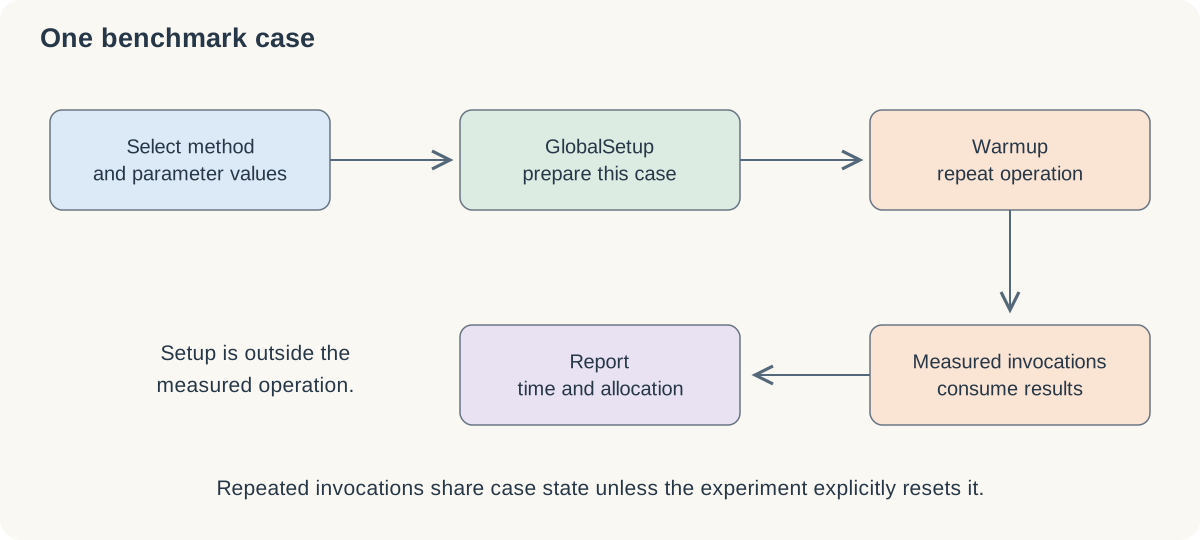
A simplified explanation of a benchmark case. Individual jobs and execution strategies can add or change stages.
By default, BenchmarkDotNet uses generated, isolated benchmark processes. It also has other toolchains, so process isolation should not be assumed for every possible configuration. Keep the configuration with the results if you want to reproduce them.
In the summary, Mean is the average measured time per operation. Error and StdDev describe different aspects of uncertainty and variation; they are not alternate names for the mean. A tiny difference between means deserves more scrutiny when measurements vary widely.
A baseline gives the other methods a ratio to compare against. A ratio of 0.5 means about half the baseline’s measured time for that case. It says nothing about how much of the full application is spent in that operation.
The memory diagnoser adds allocated bytes per operation and collection information. The generation columns are normalized collection counts per 1,000 operations, not a count of objects allocated. Allocated bytes also differ from retained memory: an operation can allocate temporary objects that become collectible almost immediately.
Retain the report, runtime and machine details. BenchmarkDotNet can export results for further analysis, and a spreadsheet or plot often makes changes across input sizes easier to see. A BenchmarkSwitcher can help select among several benchmark classes as the experiment grows.
Arrays and dictionaries: count the work
Another useful comparison searches for values in small collections. The candidates include a linear array search, binary search on sorted data, and dictionary lookup.
Big-O notation describes how work grows. It does not give the elapsed time for a collection of ten items. A compact linear scan can be very competitive at small sizes. Hashing, comparison costs, branches and the memory access pattern all contribute to the actual result.
In that historical experiment, the value-type array did well for small collections, with crossovers in roughly the twenty-to-thirty-element range depending on the dictionary operation. Those numbers belong to that experiment. Changing the key type or machine can change the result. Repeating the comparison with reference types produced a different balance.
A dictionary indexer and ContainsKey followed by the indexer also do different amounts of lookup work. When absence is a normal possibility, TryGetValue expresses a combined operation:
if (valuesById.TryGetValue(id, out var value))
{
    Use(value);
}
Its Boolean result tells us whether the key was found. The out value by itself does not establish that, especially when the stored type has a meaningful default value.
Use the same query values and order for every candidate. If the real workload contains misses, include them. If a sorted representation is prepared once and searched many times, timing lookup separately can be useful. If each request must construct and sort it, excluding that preparation answers a different question.
Concatenation makes the same point
Consider combining ten strings of fifty characters. A fixed expression containing all the operands gives the compiler a different problem from repeatedly appending to a growing string inside a loop.
That is why “I used +” is not enough detail for a comparison with StringBuilder, String.Concat or String.Join. How many operands are there? Are they already available? Is a separator required? Are intermediate results repeatedly copied? Include the final conversion to the string the caller needs.
The resulting time and allocation figures tell us about the complete operation represented by each method. The StringBuilder Myth follows that particular example in more detail.
Keep correctness beside the stopwatch
I want a benchmark to help me reject a bad idea as readily as it confirms a good one. That requires equivalent results, representative inputs and a clear boundary around the measured work.
Change one thing, run the comparison, and inspect both time and allocation. If a plot has a surprising jump, investigate it. A graph alone cannot tell you that a cache boundary, JIT decision or garbage collection caused it.
Finally, take the useful change back to the application and measure there. A convincing microbenchmark is evidence about one operation. The application tells you whether improving that operation solved the problem you started with.