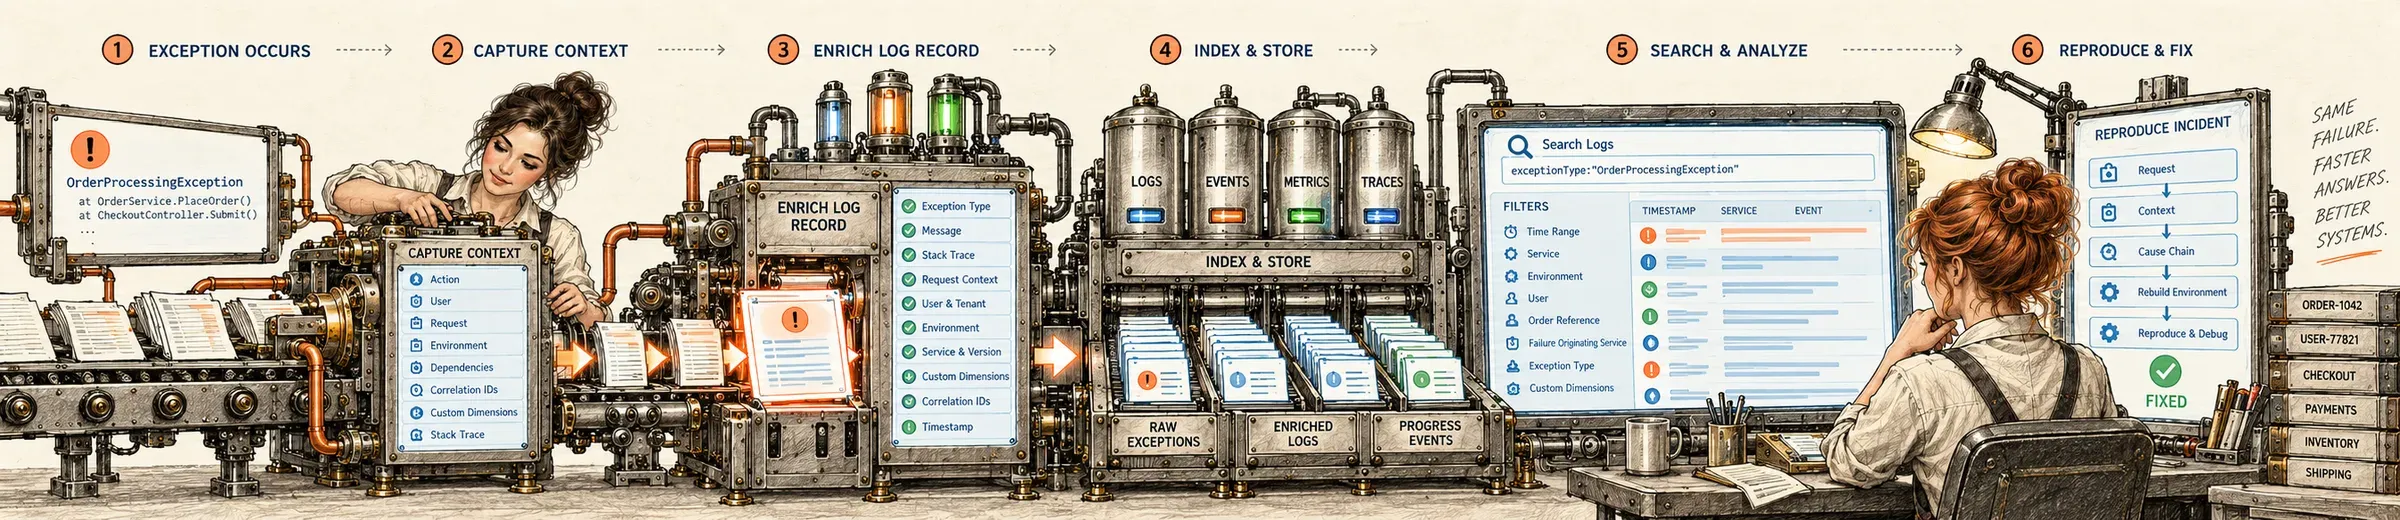
Programming to Exceptions gives logging a clear job. When an operation cannot complete, its exception carries the explanation and the facts needed to investigate it. The responsible outer handler combines that context with the incoming request and records the failure. The log should let someone identify the problem and reproduce it without reconstructing the request from guesses.
Part 1 establishes the method contracts. Part 2 builds the exception, preserves its causes, and follows it across the application and service boundaries. This part explains how that information reaches structured logs, how to find it, and when a running process also needs progress reporting.
Give each record a purpose
For an ordinary business operation, I want a complete failure record. I generally avoid informational messages announcing that a method was entered, another method was called, and the first method was left. Those messages make the log bigger while leaving someone to assemble the explanation when a failure occurs.
A business exception is an intentional refusal under the business rules. The system has done what we designed it to do. Receiving that refusal is no reason to surround every method with a try-catch or treat the application as broken. An unexpected framework exception calls for investigation. A known dependency timeout after bounded retries follows the technical policy described in Part 2.
Long-running work raises another operational question: how far has it got? A process can work for hours without reaching either success or failure. Progress events answer that question. Business audit records and operational measurements also have defined purposes. Choose what needs to be recorded for those purposes; avoid narrating the entire call stack.
Record the escaping failure at the outer boundary
The exception-handling middleware in a Web API can see both the incoming request and the exception thrown from the domain. It adds approved request facts and correlation information before logging. Intermediate callers let the failure propagate. They can contribute useful context without logging the same failure again.
Across services, the UI-facing application can record the complete transported failure chain described in Part 2. A downstream service may also keep its own local record. Each record has an owner and purpose; the main log used by the UI should contain the chain needed to investigate the whole request.
A component that successfully handles a failure has a different responsibility. The outer exception handler will never see the failure it absorbed. If the business requirement permits durable pending work for later recovery, record the pending state and the appropriate recovery event where that decision is made. Logging alone cannot justify continuing after failed work. The durable recovery policy must already establish what remains to be done and who will do it.
The logging site can select a severity appropriate to that outcome. An intentionally routine recovery event can be Information; an unusual but accepted recovery condition can be Warning. Use the declared technical-failure policy for work that still cannot complete. Keep expected recovery events distinguishable from unexpected defects in the alerting stream.
Keep provider wiring in the host
The domain needs an application-owned logging seam. The host creates its implementation and configures the providers: Application Insights, an OpenTelemetry exporter, console output, or a run file. Individual Managers and processors should not attach providers, choose destinations, or configure SDK loggers.
In a .NET host, that implementation can use ILogger supplied through the host’s logging factory. A dictionary scope is one way to attach named diagnostic properties to a log operation:
using (_logger.BeginScope(approvedDimensions))
{
    _logger.Log(logLevel, approvedException,
        "{ExceptionType}: {FailureMessage}",
        approvedException.GetType().Name,
        approvedException.Message);
}
This is a schematic logging operation, after the boundary’s diagnostic policy has approved both the exception details and the dimensions. Apply that policy to messages and causes as well as request fields. A scope containing redacted values does not redact an exception object passed separately to the logger.
Configure the selected provider to export scopes and exception details, and confirm the resulting telemetry shape. For example, Application Insights SDK versions and OpenTelemetry configuration differ in how they capture scopes; Microsoft’s migration guidance explains those differences. With the Application Insights 3.x OpenTelemetry integration, enable IncludeScopes when using scopes for dimensions. Verify the recorded properties with the SDK and exporter you deploy.
Application Insights custom dimensions
The contextual data is intended to become structured logging properties. In Application Insights, those properties appear as custom dimensions, exposed as customDimensions in its application-scoped log tables. Other structured logging systems provide the same capability under their own property or attribute conventions.
The logger must map the snapshot into those properties. A JSON object named custom_dimensions, or a formatted diagnostic string written as the message, does not by itself configure Application Insights ingestion. The telemetry adapter has to supply the values through its supported property mechanism. The Application Insights telemetry model describes custom properties on telemetry items.
Store fields such as ExceptionType, Action, OriginatingService, DownstreamService, Order.Reference, and Customer.Id as separate dimensions. For a distributed failure, retain the full nested chain and promote useful facts about its root cause into stable dimensions such as Failure.OriginatingService and Failure.ExceptionType. Promote those facts from the actual originating record, rather than the last service to wrap it.
A log query can then identify a particular failure without searching prose:
exceptions
| where tostring(customDimensions["Failure.OriginatingService"]) == "C"
| where tostring(customDimensions["Order.Reference"]) == "ORDER-1042"
| project timestamp, problemId, customDimensions
This example uses the Application Insights application-scoped exceptions schema. When querying the underlying workspace’s AppExceptions table, the corresponding property column is Properties and the timestamp is TimeGenerated. Match the query to the scope in use. A provider that records the event as a trace uses traces or AppTraces instead; inspect the actual telemetry kind before choosing the table.
The same dimensions support filters for user-correctable refusals, provider timeouts, and failures requiring infrastructure action. They can feed dashboards and log search alert rules. A support engineer can open a matching record, inspect the boundary request and local values, and reproduce the failure using the captured facts.
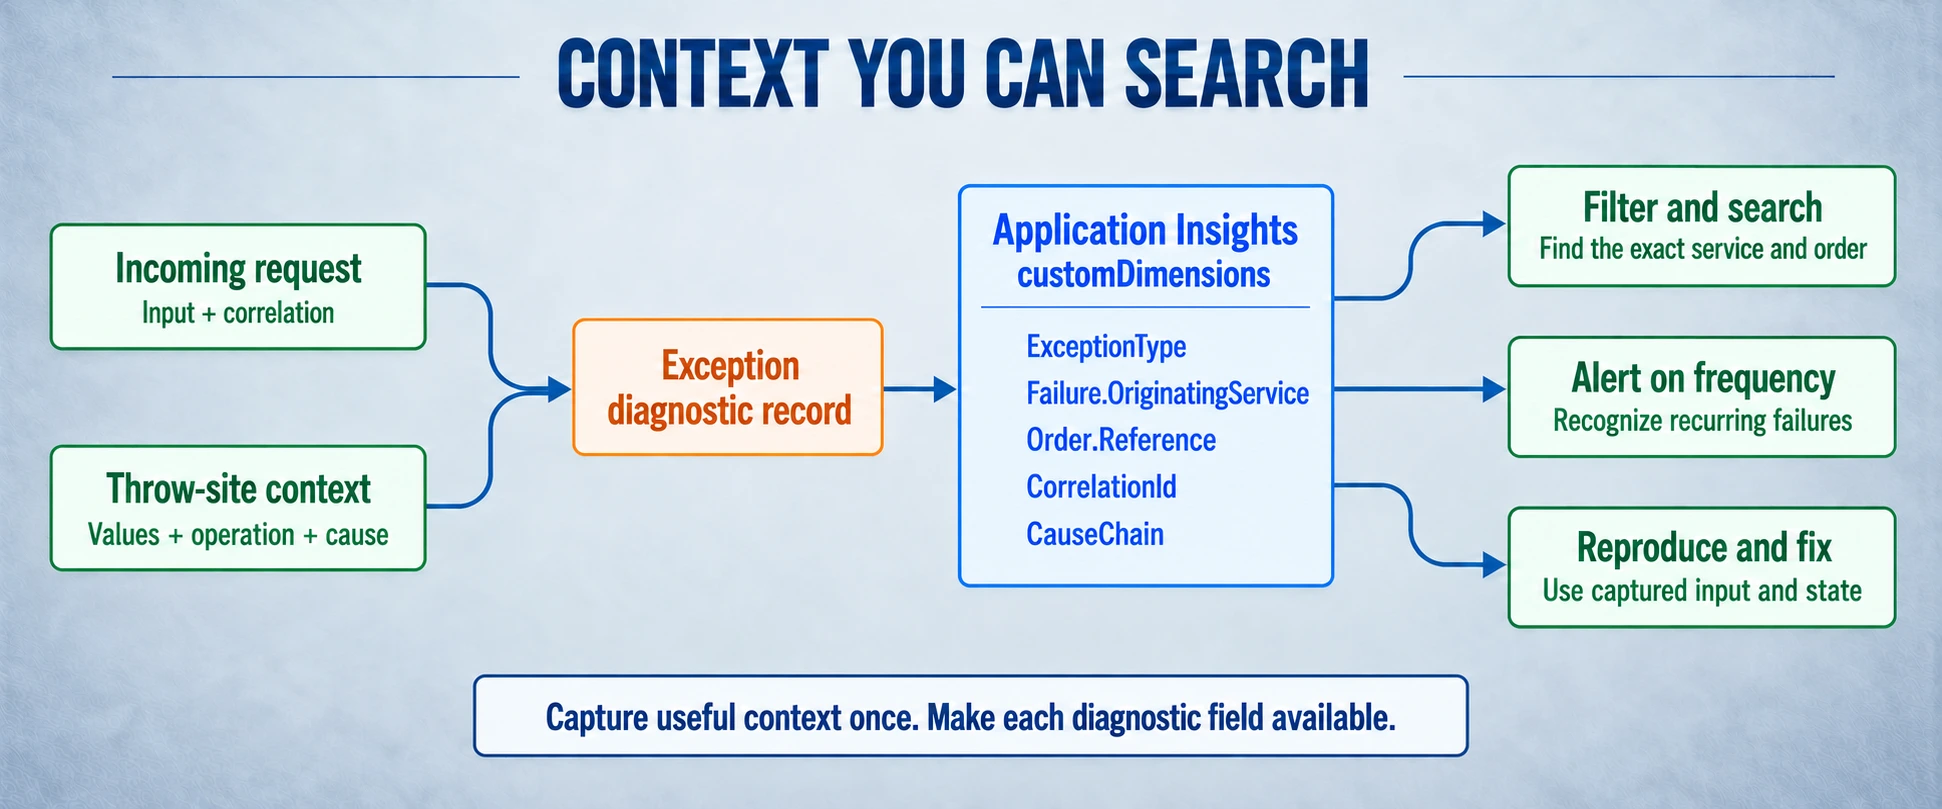
Retain the chain as structured data or a defined JSON property, and keep the dimensions used for filtering individually accessible. Check the telemetry adapter’s limits on property size and retained data. A truncated diagnostic chain cannot support the complete investigation the design intends, so large reproduction records may need approved durable storage with a reference carried in the log.
Long-running work needs deliberate progress events
Consider a document-processing run that reads many documents, extracts text, builds metadata, and stores the results. The run may take hours. An exception tells us about work that failed; it cannot tell us which step a still-running document has reached. The process should report that progress explicitly.
Use one shared vocabulary for progress and exception log events. In the C# examples, that vocabulary is the LogEventBase family introduced in Part 2. Each domain area supplies named, typed event values. A document-processing event could have the stable value Step_2.4_TextExtraction and the display name “Text extraction.” The same event identifies the step in a progress record and in an exception thrown while performing that step.
Put the reporting at meaningful step boundaries:
_progressLogger.Started(
    DocumentProcessingLogEvent.TextExtraction, runId, documentId);

ExtractedDocument extractedDocument = await _textExtractor.ExtractAsync(
    document, cancellationToken);

_progressLogger.Completed(
    DocumentProcessingLogEvent.TextExtraction, runId, documentId,
    extractedDocument.PageCount);
These are teaching names for the processor’s application-owned collaborators. The progression is the point: announce the step, perform it, then announce completion. If extraction throws, execution never reaches Completed. Do not put a completion event in finally; that would report success after failed or cancelled work. The exception still travels to the responsible handler with its step and document context.
Within a long step, report useful counts at an appropriate interval. “Completed page 12 of 40” says how much work has been done. Include the run, document, and stable step identifiers so overlapping jobs can be distinguished. Avoid dumping the document or reporting every tiny operation. Counts and elapsed time should let the operator judge rate and notice a stall.
One progress logger owns the presentation
A shared step logger renders started and completed events consistently. It owns the message templates, readable step names, and named properties. Processors supply facts; they should not each assemble their own banners or invent a different event format.
| Property | What it identifies |
|---|---|
Run.Id |
The processing run. |
Document.Id |
The item being processed. |
LogEvent |
The stable operation or step. |
Progress.State |
Started or completed. |
Progress.CompletedCount |
Work completed within the step. |
Progress.TotalCount |
Expected work, when known. |
Progress.ElapsedMilliseconds |
Time spent so far or through completion. |
The human-readable message and structured properties describe the same event. A run file can present those events as readable lines; the telemetry destination can make the properties searchable. The host configures those destinations once. A third-party SDK’s retry or progress messages are also a host-level logging decision.
Event values become contracts once queries, dashboards, or alerts use them. Reorganizing the pipeline must not silently rename the events underneath monitoring. Keep established values or deliberately migrate their consumers. Display order and display names can evolve without treating every reordered step as a new event identity.
Reproduction needs the relevant state
A useful failure record combines the request, throw-site values, causal chain, and the operation or step that failed. Reproduction may also depend on database state, provider responses, configuration versions, and the timing of concurrent work. Capture those facts when they affect the scenario. A request snapshot alone cannot promise reproduction of every incident.
Use qualified property names so contributors retain their own facts: Order.Reference, Provider.RequestId, HttpRequest.Path, and Progress.CompletedCount. Keep the dimensions needed for filtering individually accessible even when the full diagnostic package is also stored as JSON.
Retain safe facts that explain a correction. A configuration failure should identify the setting, the non-sensitive rejected value, the permitted range or units, and the remedy. Redaction should protect credentials and sensitive content while leaving ordinary operational facts understandable. A malformed connection string can report the error position and expected syntax without echoing a possible password; shortening a secret-bearing input is not redaction.
If a complete reproduction package exceeds the telemetry destination’s limits, store the approved package durably and carry its reference in the log. Sampling, retention, property limits, and provider failures affect which evidence remains available. Serialization or logging failure must not conceal the initiating exception. Define how the host preserves a minimal failure signal when its preferred diagnostic destination is unavailable.
Verify the record people will actually use
Acceptance testing should verify the boundary outcome and diagnostic record together. Supply known input, cause the specific failure, then inspect the actual recorded result. Confirm the concrete type, meaningful message, correction or remedy, approved incoming values, and the original causes. Verify the HTTP response’s status and caller-safe explanation separately.
Check that diagnostic text and JSON describe the same snapshot. Also check that the configured telemetry adapter exposes the intended values as separate dimensions. For concurrent failures, retain every item’s failure rather than one arbitrary sibling. For a service chain, verify the originating service and the context added by each hop.
For a long-running process, verify that started and completed events use the same run and step identity, counts mean what they claim, and failed work never produces a success event. Required progress records must survive the configured log-level filters. These checks establish that the logs contain useful evidence, rather than merely establishing that a logging method was called.
The speed of diagnosis depends on the useful facts that survive in the record. When the operator can identify the originating failure and recover its inputs, the team can reproduce the problem and verify the correction much sooner.